Sunday, February 26, 2017

The Impact of Circadian Disruption

Nathan Sylte
Final Lab Report
Biology 319
The Effects of Environmental Circadian Disruption on Mice

Introduction. Disruption of circadian rhythms in humans is a common occurrence in modern life and is believed to have serious health implications with regards to certain pathological disorders, coronary heart disease, peptic ulcer disease, and detrimental pregnancies (Knutsson 2003). However, it is not completely understood what some of the specific consequences ECD (Environmental Circadian Disruption) might have on growing animals and animals in general. This is especially true with regards to how ECD might alter an animal’s daily activity level. (Rice et al., 2008) showed chronic stress, specifically during the early phases of the lives of mice, had long term consequences on their health. This study specifically showed mice that had undergone chronic stress early on in their lives exhibited disruption to their hypothalamic/ pituitary-adrenal system. Another potential consequence of prolonged ECD would include increases in mortality. Research has shown that the shifting and shortening of light cycles causes an increase in mortality in mice (Davidson et al. 2006) (Park et al. 2011).
            So what can be concluded about our current understanding of the effects of ECD and stress on animals? Stress during puberty has been shown to decrease metabolic activity in male mice (Bastida et al. 2014). This is important because physical activity is connected to metabolic activity (Speakman and Selman 2003). Furthermore, research has shown regular and prolonged ECD can lead to sleep loss in mice (Brager et al. 2013). This same study also showed that chronic exposure to ECD led to an elevated inflammatory response. These findings agree with (Majde and Krueger 2005) that showed sleep disruption can be paired with alterations in the immune response. Furthermore, stressful events have been shown to cause an increase in specific organ weights in the spleen, heart, and adrenal glands in mice (Welch 1969). Stress can also have affects on other organs as well. For example, prolonged stress can impact the weights of thymus glands in mice, leading to a decrease in weight (Kubera et al. 1998). Our interest is to examine the potential stress related outcomes that ECD can have on mice. Specifically, we are interested in assessing the possible affects regular daily rhythms have on growing animals with regards to stress/anxiety levels, daily activity levels, and health.        
Methods. A total of forty-eight C57BL/6J mice between 4 to 5 weeks old were used. Mice were housed in polypropylene bucket cages (22 x 22 x 44 cm) with wheels that monitored activity levels. The cages allowed for easy access to food (Harlan 8604 chow) as well as water. Mice where divided into four groups which included constant cycle females (n=12), constant cycle males (n=12), shifting females (n=12), and shifting males (n=12). Mice treated with the constant cycle served as controls. The experiment began with a total of twelve mice in each group, with the animals being weighed before the experiment began, and then at 2-week intervals after. Mice treated with the constant cycle were put on a twelve hour light/dark cycle with the light being on from 6 am to 6 pm. The twelve hour light cycle was not altered at any point during the experiment. Mice on the shifting light cycle (mice undergoing ECD) were put on a twelve hour light/dark cycle. However, the light/dark times were shifted eight hours earlier after four days and eight hours later for the three remaining days. This shifting pattern was kept for the entire length of the experiment.
            After eleven weeks of living under their specific light/dark cycles, mice were put through a test that tested their stress and anxiety levels. The test involved placing mice in an elevated plus maze for five minutes and was done within four hours of the midpoint of the light phase. The elevated plus maze procedure used was based off of (Walf and Frye, 2007). The elevated plus maze is a cross-shaped platform that is elevated 40 cm from the floor. The arms of the plus maze are 30 cm long and 5 cm wide, with walls surrounding two of them. The arms that are surrounded by walls are directly across from each other, and only at the center are the walls absent to connect the two sections. The procedure involved each mouse being removed from its home cage, and then placed in the plus maze which is in a different room. The mouse is placed in the center of the plus mazing facing the open arm. The handler then moves out of the room, while the timer and recorder complete the test. The number of entries into the open arms, number of entries into closed arms, time in open arms, and time in closed arms are measured. After the five-minute test, the handler took the mouse back to its home cage, and the interior of the maze was cleaned with 70 percent ethanol to get rid of any odor the mouse may have left. Mice that froze or jumped off of the maze were excluded from the plus maze test.  
            After mice underwent the plus maze test, they were euthanized humanely with carbon dioxide and specific organs were harvested, then weighed. Organs were harvested in the following order and weights were recorded: spleen, liver, adrenal gland, kidney, thymus, heart, and testis. Mice that underwent altered light cycling were compared with controls. Organ weight, body weight, elevated plus maze results, and daily activity levels of control mice were compared. Data from two anapthalmic (lacking eyes) mice were excluded. Unpaired T-tests and anova tests were used to analyze results, and Graph Pad Prism 5.0 was used to create all figures. A Mann-Whitney test was used to analyze entry results from the elevated plus maze test.
Results. Activity levels between control and ECD mice were found to be significantly different (fig 1). This was true for both female and male mice. Mice that had undergone environmental circadian disruption displayed significantly less activity levels. Male ECD mice had lower activity levels compared to male control mice (p<0.0001), than female ECD mice did when compared with female control mice (p=0.005). The differences found in activity levels between control and ECD mice were the only significant differences found in the experiment.
 Although analysis of the data did not show any significant differences (P>0.05) in organ and body weights, trends in the data were found. When comparing adrenal gland weights between control and ECD mice, the adrenal glands of ECD mice tended to weigh less than that of control mice (fig 3). This was true for both female and male mice. However, the differences in adrenal gland weights between control and ECD mice were not significant in both female and male mice. While the adrenal gland weights of ECD mice tended to decrease, spleen and thymus weights of ECD mice showed a trend of increase (fig 3). The spleens of male ECD mice more greatly increased in weight than the spleens of female ECD mice when compared with control mice. Although spleen and thymus weights in both female and male ECD mice were greater than that of control mice, the differences were not significant. Testis weight in ECD mice also tended to increase when compared with testis weight of control mice (fig 6). However, this difference in weight was proven to not be significant. Male ECD mice showed a slight decrease in their liver and heart weights compared to male control mice (fig 4). This trend was contrary to what occurred in female mice. Female ECD mice presented liver and heart weights that were slightly higher than that of female control mice (fig 4). In spite of the fact there were differences between control and ECD liver and heart weights in both female and male mice, these differences were not significant. There was little difference shown when comparing female and male ECD mice kidney weights with control mice kidney weights (fig 4). The slight increase in ECD mice kidney weight that occurred in both female and males was not significantly different than the kidney weight of control female and male mice. Final differences in body weights between both female and male ECD mice also proved to not be significant when compared with the final body weights of control mice (fig 2). However, it should be noted that female and male ECD mice weighed slightly less at the end of the experiment than control mice.
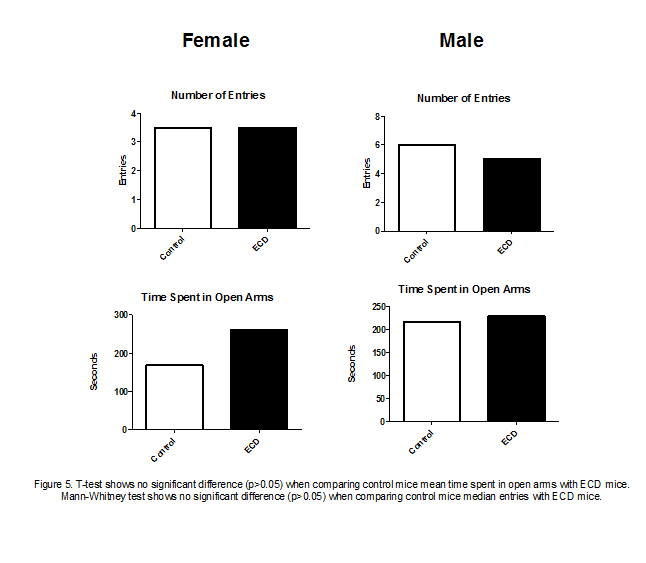
            The elevated plus maze test results also yielded no significant differences between ECD mice and control mice (fig 5). When comparing the number of open arm entries of female ECD mice with female control mice, it can be observed there was no trend in the data. However, male ECD mice made slightly less open arm entries than male control mice. Analysis of the amount of time mice spent in the open arms of the maze showed that both female and male ECD mice generally spent more time in the open arms than control mice did.
Discussion. Our hypothesis that environmental circadian disruption would have affects on the stress/anxiety levels, activity levels, and health of mice was partially supported. This support comes from the activity data we collected (fig 1). Research by (Speakman and Selman 2003) shows there is a relationship between physical activity and metabolic rates. Furthermore, research has shown that stress can decrease metabolic activity (Bastida et al. 2014). Therefore, it can be thought that stress can have an influence on an animal’s daily activity levels. Our findings agree with (Bastida et al. 2014) in that stress can impact metabolic activity. In our case, it was possible ECD acted as a stressor to the mice, which in turn potentially impacted their metabolic activity, causing them to display lower activity levels than control mice did. Although we did not directly measure metabolic activity in our experiment, the activity data indicates metabolic activity may have been affected by ECD.
            The organ and body weight data did not support the part of our hypothesis that environmental circadian disruption would have significant impacts on specific organs in mice. However, there are certain trends in the data that agree with previous research. An example of this would include the final spleen weights of ECD female and male mice (fig 3). The trend we found was ECD mice had slightly enlarged spleens, though not significant (p>0.05). These results agree with (Welch 1969), which found stressful events can lead to the enlarging of the spleen, adrenal glands, and hearts of mice. Contrary to what was found in their study regarding the enlargement of adrenal glands as a result of stress, our results showed a trend of decrease in adrenal gland weight (fig 3). Similarly, final heart weights (fig 4) were not supported by (Welch 1969). They found stress led to an increase in heart weight, whereas we found no significant difference of increase or decrease in heart weight. We suspected thymus weight in ECD mice would decrease based on the study done by (Kubera et al. 1998), which showed mice undergoing stress displayed a decrease in thymus weight. However, our results were not supported by their research. Our results showed there was a trend of enlargement of the thymuses of both female and male ECD mice (fig 3), though it was not significantly different. Lastly, we expected to see a decrease in the body weights of ECD mice. Research has shown chronic stress can lead to a reduction in body weight in mice (Jeong et al. 2013). Our results were not supported by (Jeong et al. 2013), for we found there was no significant difference in final body weight (fig 2). There may have been a reason for the lack of decrease in body weight in ECD mice. When comparing activity data (fig 1) with body weight data (fig 2), it can be seen that ECD mice ran significantly less, however they weighed similarly to control mice. Therefore, it is possible the lower activity levels concealed what otherwise would have resulted in a reduction in body weight.
            Our elevated plus maze results, to our surprise, did not show ECD mice were more stressed or anxious than control mice (fig 5). The elevated plus maze is commonly used to assess anxiety related behavior in rodents (Walf and Frye, 2007). If ECD was indeed causing stress and anxiety in mice, then we would have expected to see ECD mice behave more anxiously than control mice. However, we did have several mice freeze or jump off the maze during the test. This is extremely uncommon (Walf and Frye, 2007), and we did not expect this to occur as much as it did. It is possible there may have been something about the environment or the materials used in constructing the plus maze that caused the mice to behave in the manner they did. Also, it is possible the strain of mice we used (C57BL/J6) may behave non-anxiously in general.
            So what can be concluded about the effects of ECD as a stressor on mice, and why is ECD a relevant topic for research? Although we did not conclusively show ECD extremely affects and stresses mice, we did show ECD can alter activity levels in mice. This means ECD may alter metabolic activity in mice. Future studies might look at how ECD directly affects metabolic activity in mice. Furthermore, a larger sample size should be used in the future. The reason is we found certain trends in the weight data. A larger sample size could potentially show, for example, ECD causes enlarged spleens in mice. Overall, the research on circadian rhythms and shift work is extremely important. The demands and commonplaces of modern life involve the disruption of circadian rhythms in humans. A better understanding of circadian disruption induced stress could lead to an increase in knowledge about potential health problems associated with ECD.


References


Bastida, C.C., Puga, F., Lima-Gonzolez, F., Jennings, K.J., Wommack, J.C., Delville, Y. et al.
(2014). Chronic Social Stress in Puberty Alters Appetitive Male Sexual Behavior and Neural Metabolic Activity. Hormones and Behavior. Vol. 66(2): 220-227.
Brager AJ, Ehlen JC, Castanon-Cervantes O, Natarajan D, Delisser P, et al. (2013) Sleep Loss         
and the Inflammatory Response in Mice Under Chronic Environmental Circadian
Disruption. PLoS ONE 8(5): e63752. doi:10.1371/journal.pone.0063752.
Davidson, J.A., Sellix, M.T., Daniel, J., Yamazak, S., Menaker, M., Block, G.D., et al. (2006).
            Chronic Jet-Lag Increases Mortality in Aged Mice. National Institute of Health. 16(21) :
            R914-R916.
Jeong, J.Y., Lee, D.H., Kang, S.S., et al. (2013). Effects of Chronic Restraint Stress on Body
Weight, Food Intake, and Hypothalamic Gene Expressions in Mice. Endocrinology and Metabolism. (Seoul, Korea). Vol. 28(4): 288-296.
Knutsson, A. 2003. Health Disorders of Shift Workers. Occupational Medicine.
 Vol.53: 103-108.
Kubera, M., Basta-Kaim, A., Holan, V., Simbertsev, A., Roman, A., Pigareva, N., Prokopieva,
E., Sham, J. et al. (1998). Effect of Mild Chronic Stress, as a Model of Depression, on the Immunoreactivity of C57BL\6 Mice. International Journal of Immunopharmacology. Vol. 20(12): 781-789.
Majde, J.A., Krueger, J.M. 2005. Links Between the Innate Immune System and Sleep. Journal
of Allergy and Clinical Immunology. Vol. 116(6): 1188-1198.


Morgan JL, Svenson KL, Lake JP, Zhang W, Stearns TM, et al. (2014) Effects of Housing
Density in Five Inbred Strains of Mice. PLoS ONE 9(3): e90012. doi:10.1371/journal.pone.0090012.
Park, N., Cheon, S., Hoon Son, G., Cho, S., Kim, K., et al. (2012). Chronic Circadian
Disturbance by a Shortened Light-Dark Cycle Increases Mortality. Neurobiology of Aging. Vol. 33: 1122.e11- 1122.e22.
Rice, C.J., Sandman, C.A., Lenjava, M.R., Baram, T.A. et al. (2008). A Novel Mouse Model for
Acute and Long Lasting Consequences of Early Life Stress. Endocrinology. Vol. 149(10): 4892-4900.
Speakman, J.R., Selman, C. 2003. Physical Activity and Resting Metabolic Rate. Proceedings of
the Nutrition Society. Vol.62: 621-634.
Walf, A.A., Frye, C.A. 2007. The Use of the Elevated Plus Maze as an Assay of Anxiety Related
Behavior in Rodents. Nature. Vol. 2(2): 322-328.
Welch, B.L., Welch, A.S. 1969. Sustained Effects of Brief Daily Stress (Fighting) Upon Brain
and Adrenal Catecholamines and Adrenal, Spleen, and Hearth Weights of Mice. University of Tennessee.


Sunday, February 12, 2017

Crayfish Research Summer 2016


Nathan Sylte

Factors Influencing Crayfish Distributions in Streams

During the summer of 2016 Evan Ziperski and I performed at regional crayfish study under the supervision of Dr. Todd Wellnitz. We were interested in examining how physio-chemical factors in streams, such as calcium levels, substrate size, and stream flow/size influenced crayfish distributions. This project began the first week of June with field work coming to an end during the last week of August. Lab, data analysis, and presentation work lasted through the semester. Our findings suggest that a streams physical factors are the best predictor of crayfish presence. While on the other hand a streams chemical makeup does not seem to strongly influence crayfish presence. 

Below is a picture of the poster that Evan and I generated. This poster highlights our research findings and will be included in CERCA this spring.  


Thursday, February 9, 2017

Depth Distribution of YOY Bluegill (Lepomis macrochirus) in an Oligotrophic Wisconsin Lake

 Diving Pine Lake Summer 2016

Depth Distribution of YOY (Young of the Year) Bluegill

During the summer of 2016 I aided in the surveying of YOY (young of the year) bluegill in Pine Lake. I performed several dives in which I recorded YOY bluegill on video camera. I also helped set and collect fish traps in order to survey the YOY bluegill. The data analysis, the writing of the poster, and presentation part of the project were performed by Dr. Dave Lonzarich and the other students on the project.. However, diving and recording fish on video in Pine Lake was a great experience that I would like to share. 


During the summer of 2016 I was primarily focused on a crayfish research project. Regardless, I was still happy to help out up at Pine Lake. 

Below is the poster that was generated by Dr. Lonzarich and company. It is hard to read so below I included snips of the different sections. It is very interesting so check it out!


How Does the Presence of a Predator Impact Whitetail Deer Feeding Behavior?


 Effects of the Addition of Coyote Urine on Whitetail Deer Feeding Behavior at Established Feeding Sites

Jenna Barlow & Nathan Sylte


INTRODUCTION
Whitetail deer (Odocoileus virginianus) are common throughout North America and thrive within diverse habitat regions, many of which have extreme temperature swings between seasons (Rooney 2001). The ability to inhabit regions that experience extreme cold as well as intense warm spells makes the whitetail deer an excellent model homeotherm. Homeotherms are presented with a metabolic challenge during winter months; therefore, whitetail deer must allocate their time in order to consume enough food, but also balance this with rumination, movement, social interactions, and sleeping (Beier and McCullough 1990). Another important part of the activity budget is vigilance.  Increased time spent on vigilance reduces predation risk, but vigilance conflicts with some types of feeding (Benhaiem et al. 2008). Deer have many predators—for example, coyotes that have been observed in packs killing whitetail deer (Gese and Grothe 1995)—and so it is reasonable to expect there will be strong selection for optimizing the ratio of time spent vigilant to time spent feeding. So with the use of predator urine as the apparent risk of a nearby predator, it would be expected that this ratio would shift to more time spent being vigilant and less on feeding.
            The introduction of predator urine to feeding sites has been shown to significantly decrease deer browsing (Swihart et al. 1991). This has important management implications because winter browsing by deer often damages nurseries, natural restoration of timber species, and substantial agriculture crop damage (Swihart et al. 1991; Bellant 1998).  Browsing by deer has also been found to significantly influence forest ecosystems (Rooney and Waller 2003). However, there appears to be little published information on the effect of predator scents on deer feeding and vigilance, though Benhaiem et al. (2008) has found that the more time spent being vigilant when exposed to predation risk can have significant consequences on roe deer energy budgets. Our objective is to study the effects on the whitetail deer activity budget by artificially increasing the apparent predation risk via coyote urine.
METHODS
Four feeding locations baited with corn were established prior to the beginning of the experiment. Sites were established one week in advance on February 29, 2016 to allow deer adequate time to find the sites. From that date on the sites were re-baited with corn every three days. Three sites are located in Dunn County and the fourth is in Chippewa County. All sites are located near woodland edges. Three of the four sites are located at or near a field edge, and the other is in a forest clearing; all sites are at least 200 meters from known deer bedding sites. Our site selection was designed to force the deer out of their comfort zones and into areas farther from cover (and thus be exposed to higher predation risk). Another factor in determining where sites were to be located was the proximity of the sites relative to each other; they were placed at least one mile apart to ensure the same deer were not using multiples of the established feeding sites. Lastly, feeding sites were placed in areas with high whitetail activity, as determined by physical signs such as tracks, heavily used trails, and fecal matter.
            To record data for the experiment, infrared/motion detecting cameras were selected as the most practical option, for they are minimally invasive and can record data for months at a time. On March 7, approximately one week after feeding sites were established, the motion cameras were placed at the four sites. After a 10-day period without coyote urine being present, coyote urine was added to each of the four sites. Several ounces of urine were deposited on a small log that could easily be removed after the 10-day period was up. Five days after the urine was originally added, several more ounces of fresh urine were added to each of the sites. This was done to simulate the frequent presence of a predator. After 10 total days of urine being present, the logs the urine was placed on were removed and the cameras were collected. Unfortunately, the camera at site two turned out to have some technical difficulties and data was unable to be collected from this site. Site two had to be excluded from the experiment.
The variables analyzed in the experiment included total deer activity, percent of deer feeding, percent of deer being vigilant, and time of activity measured by night or day. Total deer activity was measured in each of the two, 10-day periods based on the total number of deer in pictures taken and by the number of pictures taken with deer present. The time of day at which feeding occurred was also measured and was recorded as either day or night, using sunrise and sunset times to establish whether it was day or night. Alertness was measured by counting the number of deer appearing in an alert posture in the pictures. An example of an alert posture includes a deer looking up and away from the feeding site with its ears up. Deer feeding was measured by the amount of deer with their heads in the down posture. The proportion of deer in the picture in an alert posture, as well as the proportion of deer feeding were also taken. Presence of coyote urine represented the independent variable in the experiment. T-tests were used to measure for significant differences in the data. Chi-squared tests were also used in data analysis. Specifically, a Pearson's Chi-squared test with Yates' continuity correction was used.
RESULTS
Overall, whitetail deer spent proportionally more of their time  feeding (50%) compared to the time they spent being in the alert posture (30%, p<0.001). So, in general, deer budgeted more time feeding than openly being vigilant (Figure 1). To support our initial prediction, with the addition of the coyote urine to the sites, the proportion of alertness significantly increased, based on a t-test. The proportion of alertness increased from 0.29 to 0.37 (p=0.018).


 Across each of the three sites, the presence of urine tended to increase deer activity during the day. In all three sites, the proportion of time spent feeding when there was no urine present was drastically different comparing day and night. This indicates that at each site the deer had a preference to feed at one time versus the other. Whereas when there was urine present the proportion of time spent feeding was often the same amount for both day and night, suggesting the urine affected their willingness to feed. Specifically, shifting deer feed more with the presence of  light. This was especially shown in site 4. There was also always a greater proportion of deer feeding when there was no urine added. There is a pattern that emerges in Figure 3, the higher frequency of feeding either day or night remained the same even with the addition of the urine.  
         
DISCUSSION
            Our hypothesis that the addition of coyote urine would impact whitetail deer feeding behavior with regards to vigilance/alertness and willingness to feed was supported by our results. It should first be noted that deer behaved differently at each site. Night feeding was prefered at site four, while deer prefered to feed during the day at site three.  At site one, the deer tended to feed at night; however, there was more variation in their feeding times. With the presence of coyote urine, deer tended to feed more during daylight hours, while without the presence of urine they fed more at night. This indicates that the presence of coyote urine impacted their willingness to feed at night. This makes sense considering coyotes are more active at night (Andelt 1985). Although the presence of coyote urine did not stop deer from feeding at the sites, it did alter their feeding schedule as well as their budgeted time in feeding and alertness. The fact that the presence of coyote urine didn’t completely stop the deer from feeding at the sites demonstrates how important calorie replacement is for  whitetail deer. 
            Proportionally, whitetail deer spent more time feeding than they did in an alert posture (Figure 1). This is logical considering they would never be able to obtain the necessary calories to survive if they spent a majority of their time in an alert posture instead of feeding. With the presence of coyote urine, the budget for this behavior was altered. Whitetail deer were significantly more alert with the presence of urine than without (Figure 2). Therefore, they did not spend as much time feeding as they otherwise would have. This result does not contradict the study of Swihart et al. which found that the presence of predator urine significantly reduced deer browsing.
            Temperature may have represented an important potential covariate in our experiment. Although the effects temperature had on whitetail feeding behavior were not directly measured in our experiment due to camera complications, temperature has been shown to influence deer activity (Beier and McCullough 1990). It is possible that some of the cooler temperature swings during the second part of the experiment (urine present) influenced the deer to feed more during the day. However, the extent to which temperature influenced whitetail deer feeding behavior in our experiment is uncertain. Future studies may want to better analyze how temperature influences whitetail feeding behavior. It is possible that whitetail may be more vigilant during colder time periods and may spend substantially more time feeding during the day.
            Overall, studying animal behavior is difficult but important. At any point in time there may be many different variables influencing the way an animal is behaving, which makes studying how animals behave in the wild challenging. There is still much knowledge to be gained in the study of homeotherms and homeothermy. Further advancements in the study of homeotherm behavior will only benefit our overall knowledge of homeothermy. 
REFERENCES
Andelt, W. F. (1985). Behavioral Ecology of Coyotes in South Texas. The Wildlife Society, 94, 3-45.
Allen, E.O. 1968. Range use, foods, condition, and productivity of white-tailed deer in Montana. The Journal of Wildlife Management 32:130-141.

Beier, P. and D.R. McCullough. 1990. Factors influencing white-tailed deer activity patterns and habitat use. Wildlife Monographs 109:3-51.

Bellant, J.L., T.W. Seamans, and L.A. Tyson. 1998. Predator urines as chemical barriers to white-tailed deer. Proceedings of the Eighteenth Vertebrate Pest Conference Paper 4.

Benhaiem, S., M. Delon, B. Lourtet, B. Cargnelutti, S. Aulagnier, A.M. Hewison, N. Morellet, and H. Verheyden. 2008. Hunting increases vigilance levels in roe deer and modifies feeding site selection. Animal Behaviour 76:611-618.

Gese, E.M. and S. Grothe. 1995. Analysis of coyote predation on deer and elk during winter in Yellowstone National Park, Wyoming. The American Midland Naturalist 133:36-43.

Rooney, T.P. 2001. Deer impacts on forest ecosystems: a North American perspective.
Forestry 74.3:201-208.

Rooney T.P. and D.M. Waller. 2003. Direct and indirect effects of white-tailed deer in forest ecosystems. Forest Ecology and Management 181:165-176. 

Swihart, R.K., J.J. Pignatello, and M.J.I. Mattina. 1991. Aversive responses of white-tailed deer, Odocoileus virginianus, to predator urines. Journal of Chemical Ecology 17:767-777.


Wednesday, February 8, 2017

Pine Lake Project Bluegill Nest Survey

Nathan Sylte

Pine Lake Project 2015

Bluegill Nest Survey 

Background:

Pine Lake is a pristine lake located in Chippewa County near Long Lake. The lake is fairly under developed and possesses a smaller number of cabins. Public access is limited, however, there is still public access to the lake. During the summer of 2015 Corey Yonke and I completed a survey of nesting bluegills throughout Pine Lake. UTM coordinates were taken at the nesting sites and I used this data to generate a map of the nesting sites. 

Below is the map that was generated. 

Sunday, February 5, 2017

CPOM in Little Niagara, Invertebrate Density and Species Richness

Team CPOM (Course Particulate Organic Matter) 
Aquatic Ecology Lab Project

Overview:
We will be looking at how different types of CPOM are related to stream invertebrates. Specifically, we will be looking at the interactions and relationships between three different types of CPOM and one mixed treatment of CPOM. The mixed treatment will include all three types of CPOM. The three types of CPOM we will be looking at will include leaves, needles, and woody debris. The specific leaves, needles, and woody debris used will be maple leaves, white pine needles, and a mixture of woody debris found in the forest. We may also include a treatment where nothing is used.
The factors we will be measuring include CPOM invertebrate diversity and the numbers of individual invertebrates of different species on the different types of CPOM. Stream current velocity will be held as a constant. To characterize the stream as a whole we will include four independent replicates throughout the stream. However, the four different sites will be the same as far as current velocity goes. This will insure the bottom will be relatively similar as well. Equal weights of CPOM will be placed in each habitat. There will be a total of four habitats at each of the four locations. A total of 16 habitats.
Materials:
-        16 Mesh fruit bags
-        CPOM of the three different types collected by Nate
-        Current velocity meter
-        Invertebrate collection gear from lab
-        Weight for each fruit bag. So 16 rocks
Data Analysis:
            We can’t do a basic t-test if we are just comparing the mixed treatment to the individual types of CPOM. A multi-way anova test would be better suited for comparing mixed with the three other types. We plan on running t-tests between the individual habitats. For example, we will compare invertebrate diversity between leaves and needles.